Welcome to Tidal Wave
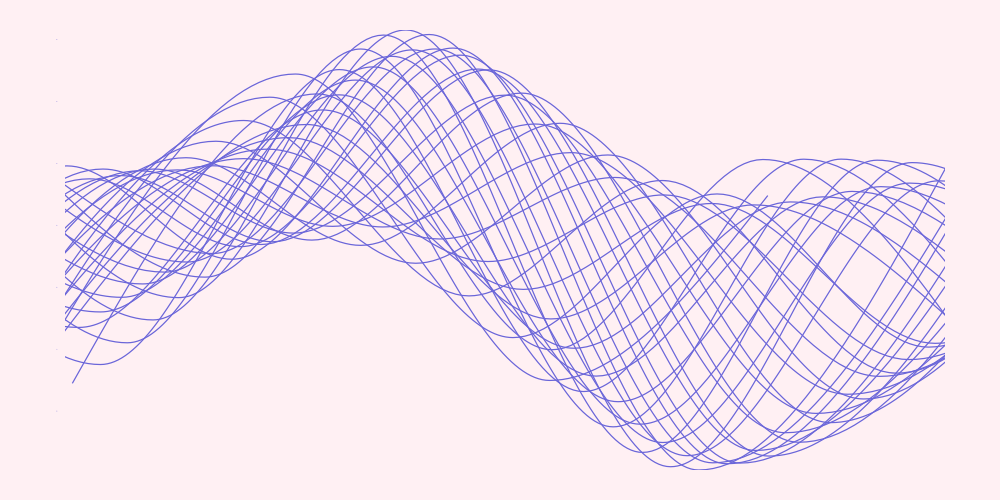
Tidal Wave is a visual exploration of NOAA's high/low tidal projections. By focusing on more artistic interpretations of the marigram, we can begin to see some of the daily and monthly patterns that exist in the tides. This project was inspired by Adrien Segal's Tidal Datum.

Figure 1: A screenshot of the layered line chart from 11-22-19. See the live chart here.
Data Source
All the tidal projections being used in these visualizations are from the National Oceanic and Atmospheric Administration's (NOAA) Tides and Currents Tidal Predictions portal. All charts are showing the next 30 days of projections from the Moss Landing, Ocean Pier station (shown on map below).
Figure 2: Moss landing is in central California, about 28 miles from Hollister, my hometown.
Age of moon is calculated using the simple method from Ben Daglish Moon Phase Calculators. Lunar projections are approximations, and for this project, I opted for simplicity over accuracy.
About me
I'm Violet. I love data visualization and the ocean. You can also check out my other projects.